Mitigating the risks of climate change
Mitigating the risks of climate change
"NIWA uses GIS to map and interpret modeled climate change projections over New Zealand and provides these to a range of end-users, for example, regional councils, industry, and other researchers. These maps allow decision-makers to understand potential future changes in climate at a high resolution across New Zealand and make planning decisions accordingly." - Petra Pearce, Manager – Climate, Atmosphere & Hazards at NIWA.
Events such as the Australian wildfires at the beginning of this year brought climate change to the forefront of the public consciousness. Record-breaking temperatures and severe drought provided the ideal conditions for wildfires to establish themselves. In a local, albeit less extreme example, the Auckland drought this year is one of the severest droughts in modern times. According to NIWA regional climate models, such climatic patterns will be expected in higher frequencies over the course of this century.
Although the future may seem grim, science and technology can still guide us toward a better understanding of climate change and ultimately, the development of mitigation strategies against its impacts. Mapping environmental problems is crucial to establishing a link between the state of the climate and potential causes, and technology serves both as a powerful tool to examine climate change as well as to educate the public on its significant risks.
Geographic Information Systems (GIS) provides the framework in which we can collect, analyse, and manage geographic information. Most data are inherently spatial, and climate change data is no different.
Some ways in which researchers leverage GIS to study climate change include locating areas where temperatures significantly deviate from the global average and studying satellite data to monitor land cover changes relevant to changing climates. In New Zealand, key areas of concern include the predicted higher frequencies of extreme events such as floods and droughts, therefore modeling these and understanding how different regions will be affected is crucial to prepare adaptation strategies for the various regional and local governments.
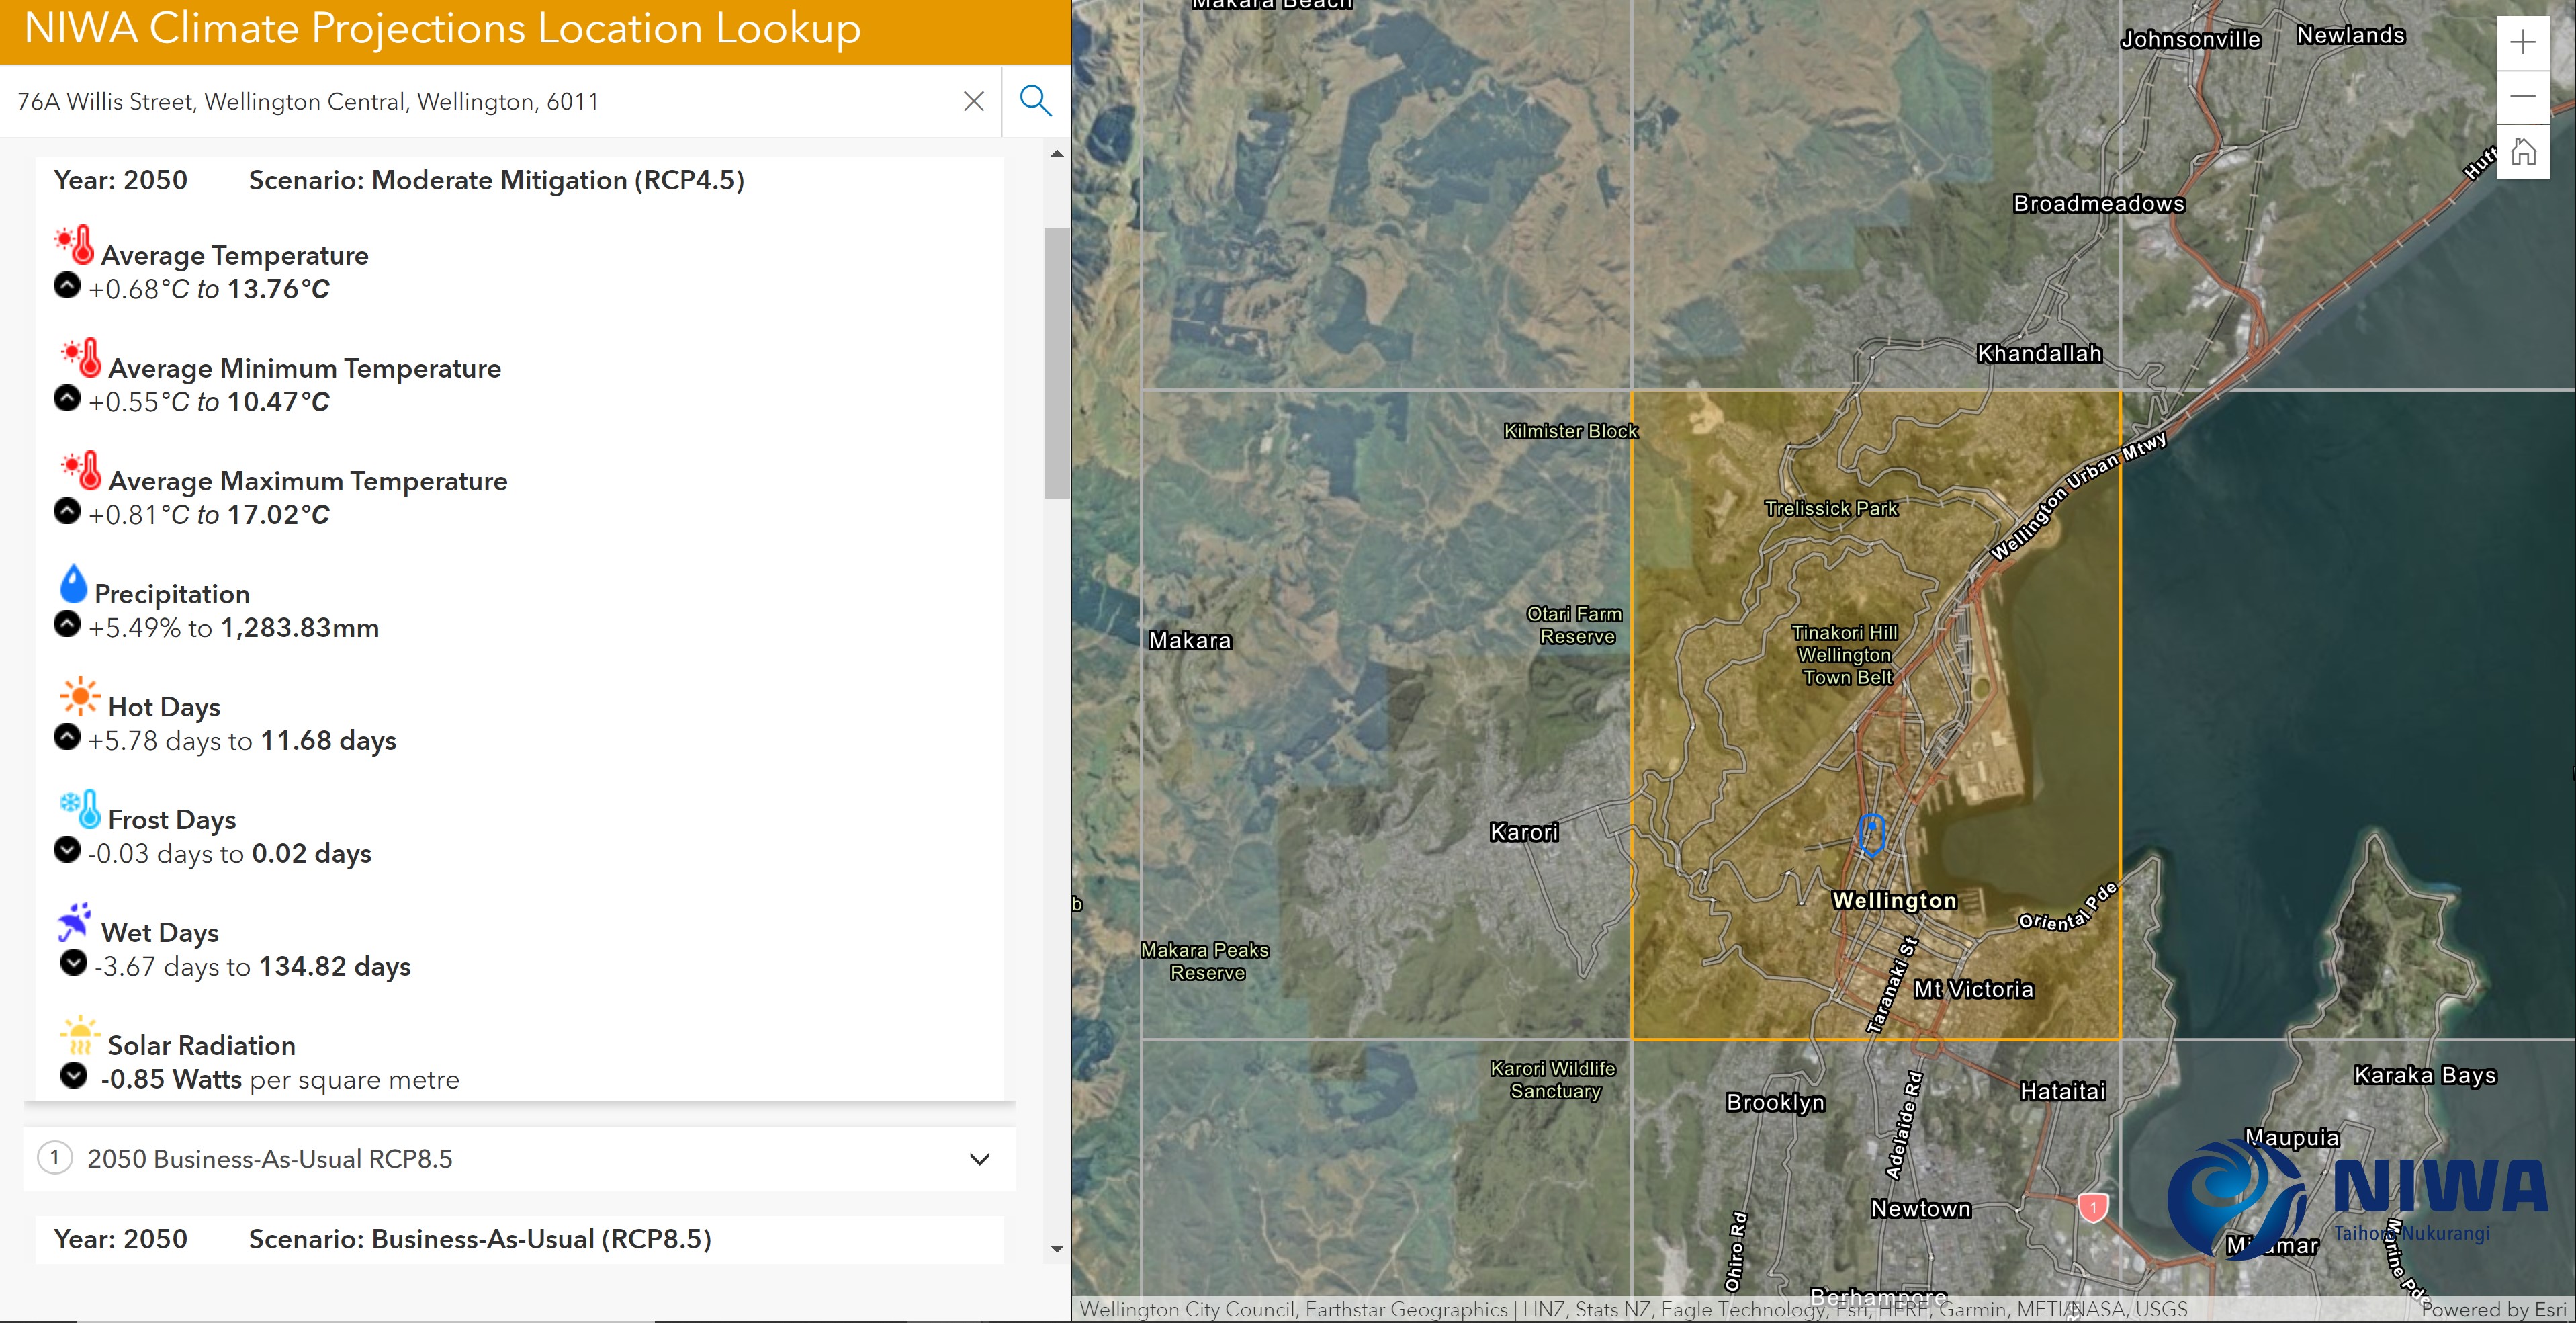
NIWA’s Climate Change Hub allows users to look up climate change projections for their area
Results of climate change studies, such as this national flood risk report from the Deep South Challenge, can be used to inform the planning of infrastructure such as roads, bridges, coastal properties, utilities pipes and more. Such knowledge produced by research institutes relies heavily on GIS tools and applications to interpret the data. When extreme events do occur, GIS intelligence and real-time situational awareness maps provide emergency personnel with vital information on which areas require the most urgent attention and can act accordingly.
In addition to the role that GIS plays in helping researchers to understand climate change and mitigate its risks, GIS tools can generate data visualisations to inform and engage the public in the form of dashboards, interactive maps and apps. Here is a brilliant example of a sea-level rise viewer for Wellington, created by Greater Wellington Regional Council. Theories and articles about climate change can only do so much to influence public perception, so establishing that solid link between the theory and real-life effects through interactive apps is key to engaging with the public.
The team at Esri recently released a podcast examining the role technology and science play in addressing systemic issues such as climate change. Give it a listen here.
View all blog posts